Plot GPX route visualisation
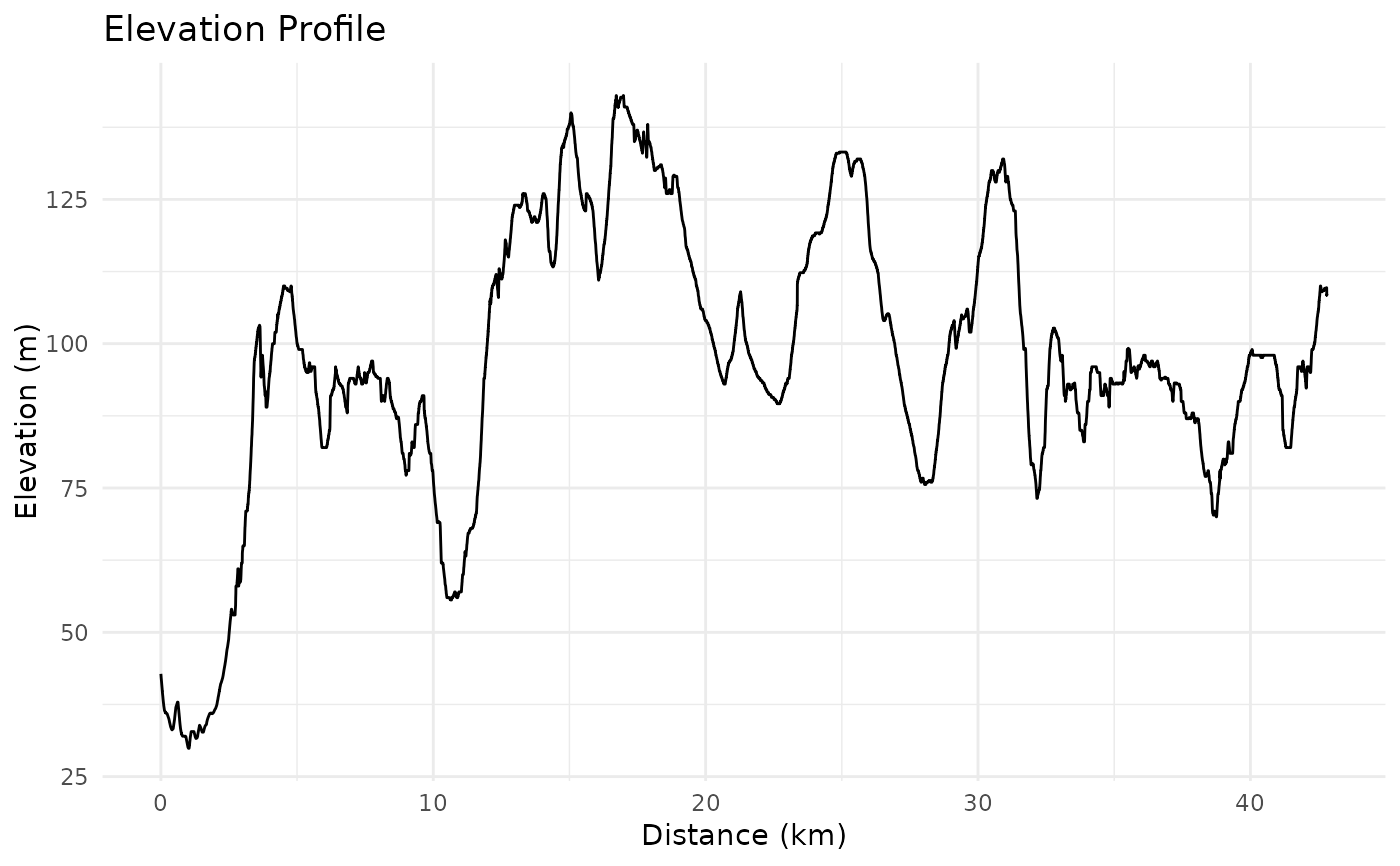
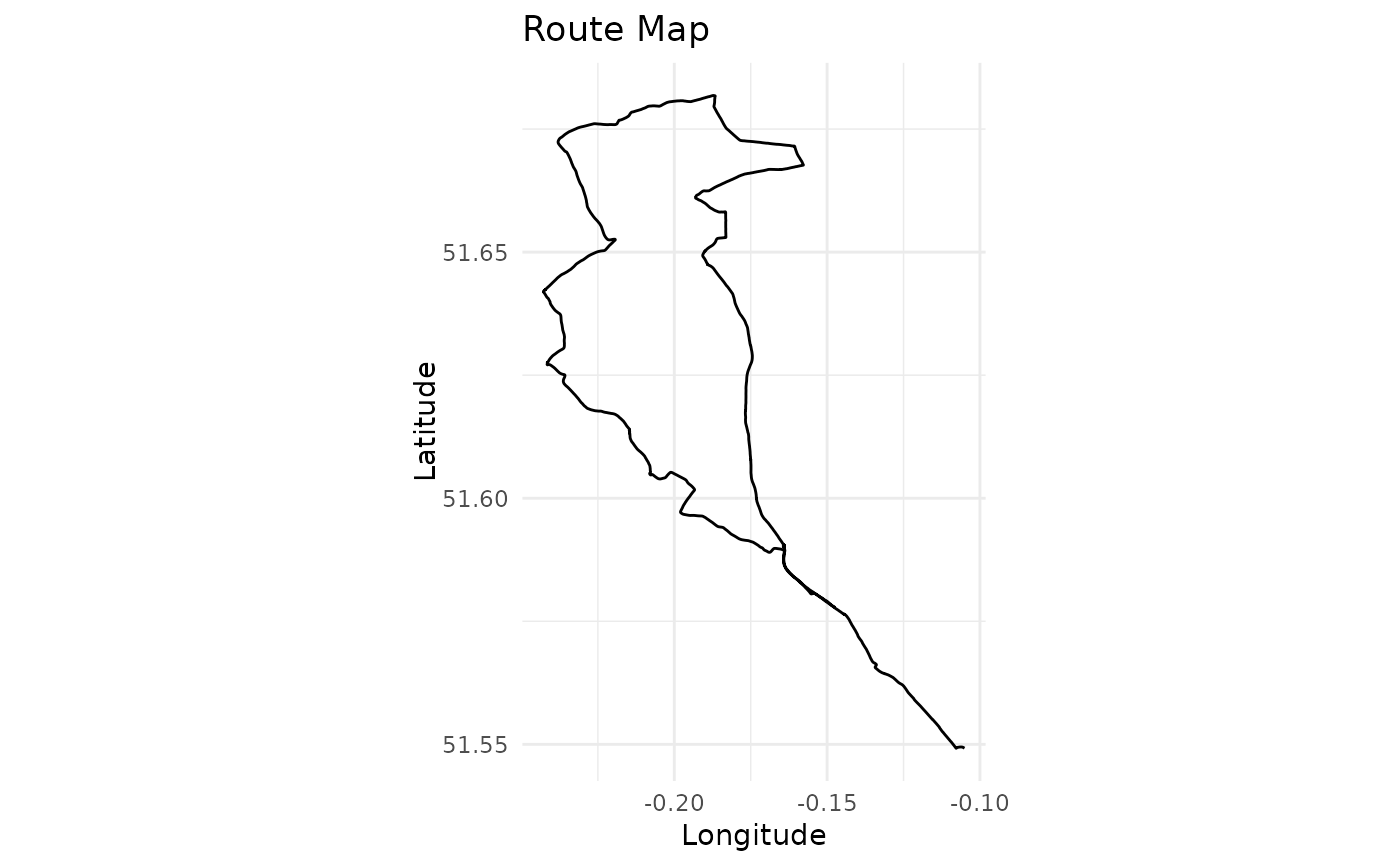
plot_route.RdCreates visualisations of a GPS route, including an elevation profile and a route map.
Arguments
- track_points
A data frame containing track points with the following required columns:
lon - longitude in decimal degrees
lat - latitude in decimal degrees
ele - elevation in metres
cumulative_distance - distance in kilometres
- mode
Character string. The plotting mode to use. Options are:
"ggplot" (default): Uses ggplot2 for visualisation.
"leaflet": Uses the leaflet package to create an interactive map.
Value
For "ggplot" mode, plots are displayed in the current graphics device. For "leaflet" mode, an interactive map is returned.
Details
This function creates visualisations based on the selected mode:
"ggplot": An elevation profile and a static route map.
"leaflet": An interactive map with a greyscale tile layer (CartoDB.Positron).
Examples
# Use the example GPX file included in the package
example_gpx_path <- system.file("extdata", "icc_intro_ride.gpx", package = "gpxtoolbox")
# First read a GPX file
track_data <- read_gpx_track(example_gpx_path)
# Calculate cumulative distance (required for plotting)
track_data <- calculate_distance(track_data)
# Plot the route visualisations
plot_route(track_data, mode = "ggplot")
 plot_route(track_data, mode = "leaflet")