On this page
OpenCode Usage Dashboard
A local, read-only tool for exporting usage recorded by OpenCode and exploring tokens, cost, projects, providers, and models in a self-contained HTML dashboard.
The exporter reads OpenCode’s local SQLite database. Its schema is an implementation detail and can change between releases. The exporter validates the tables and columns it needs and reports incompatible schemas rather than silently producing incomplete data.
Using GitHub Copilot CLI instead?
This dashboard reads OpenCode’s local session store. If your usage is recorded by GitHub Copilot CLI, the equivalent tool for that lives at github.com/microsoft/ghc-cli-dashboard.
Both are local, read-only and offline. They read different databases, so neither can substitute for the other — this one is for OpenCode, that one is for Copilot CLI. See Attribution for how the two relate.
Quick start
Requirements: Python 3.9 or later and OpenCode session data on this machine.
python -m pip install -r requirements.txt
python extract_usage.py
python dashboard.py --in "opencode_usage_*.csv" --out usage_dashboard.html
Open usage_dashboard.html in a browser. The exporter discovers the default database location when possible. Pass --db to select a custom location:
python extract_usage.py --db "C:\path\to\opencode.db"
Use --include-session-title only when you want free-text session titles in the CSV and dashboard. Titles can contain sensitive project or task details.
Screenshots
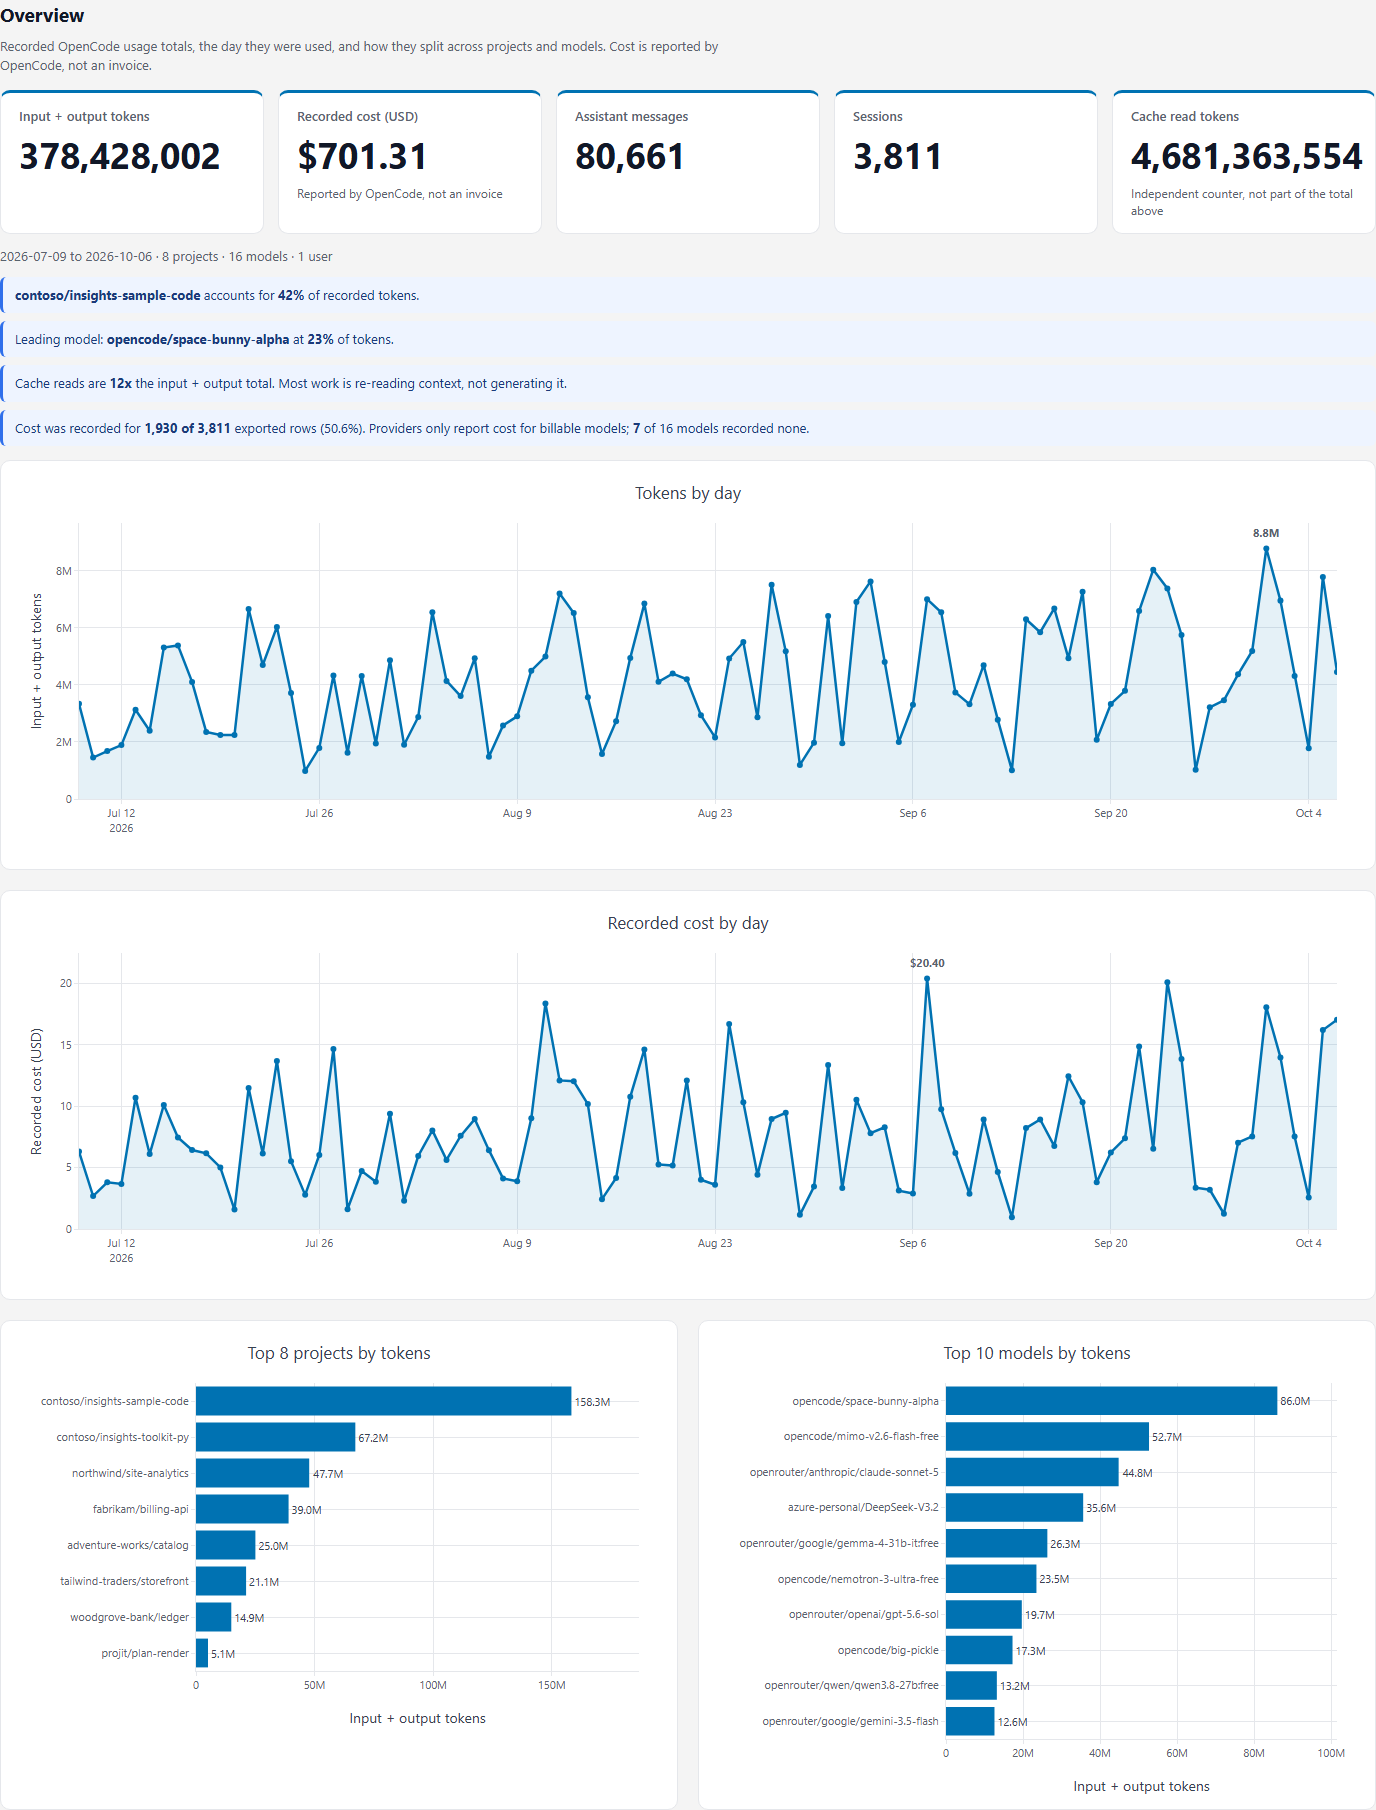
All screenshots are generated from synthetic data produced by tools/make_sample_data.py — 90 days, eight projects, sixteen models, and a deliberate mix of free and paid models so the cost and pricing-efficiency sections have something to rank. No real usage data appears here.
More screenshots
Cost and pricing efficiency, shown only when enough models actually carry recorded cost: 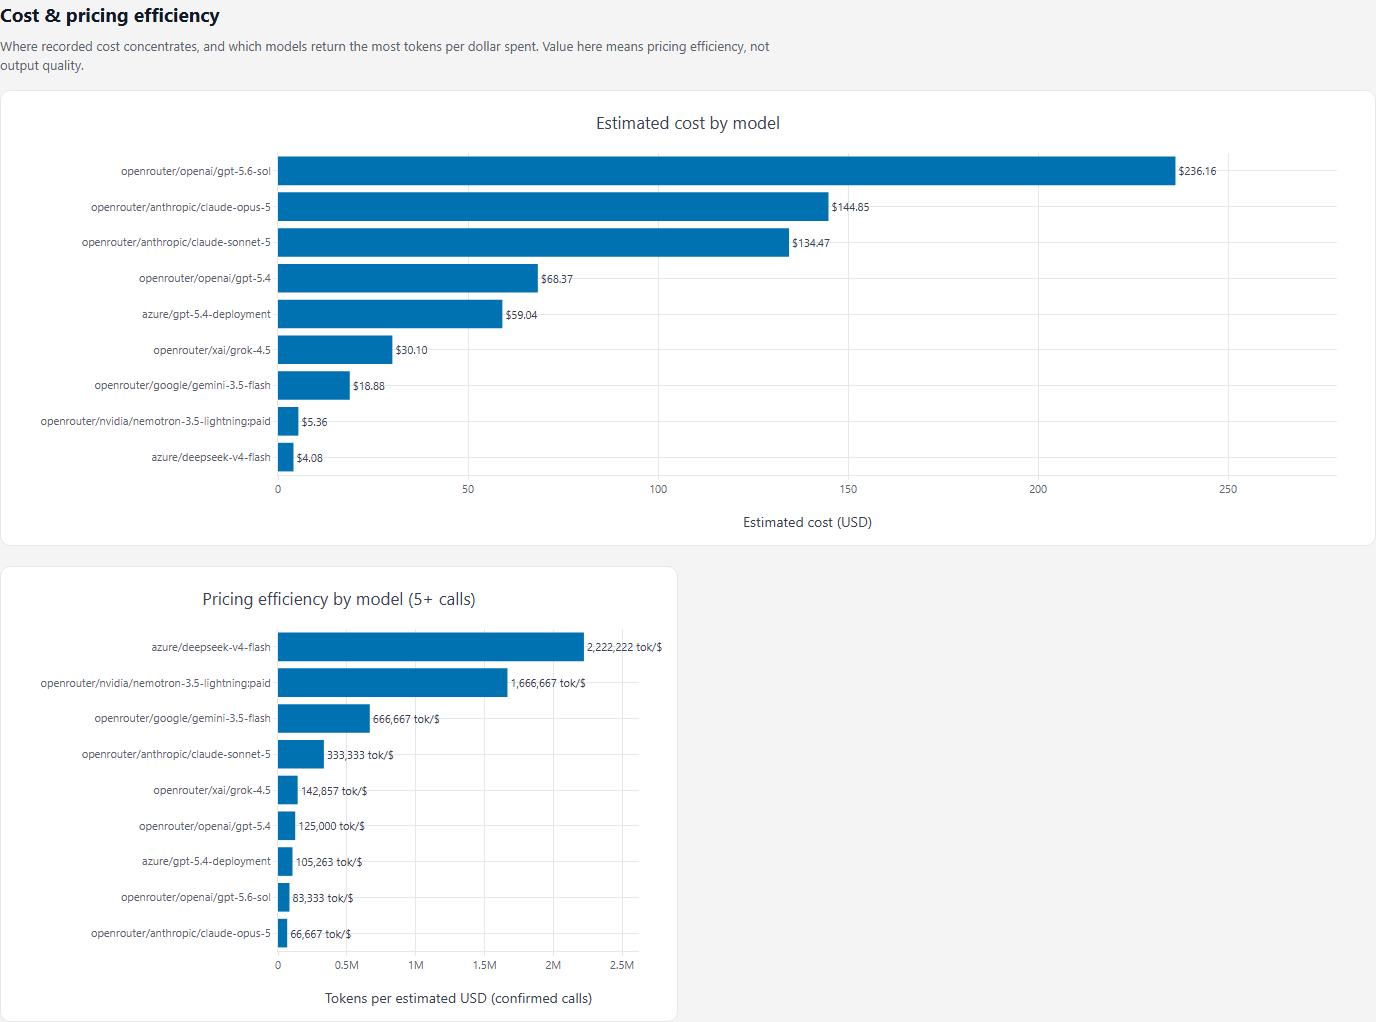 Token categories, provider mix and reasoning effort: 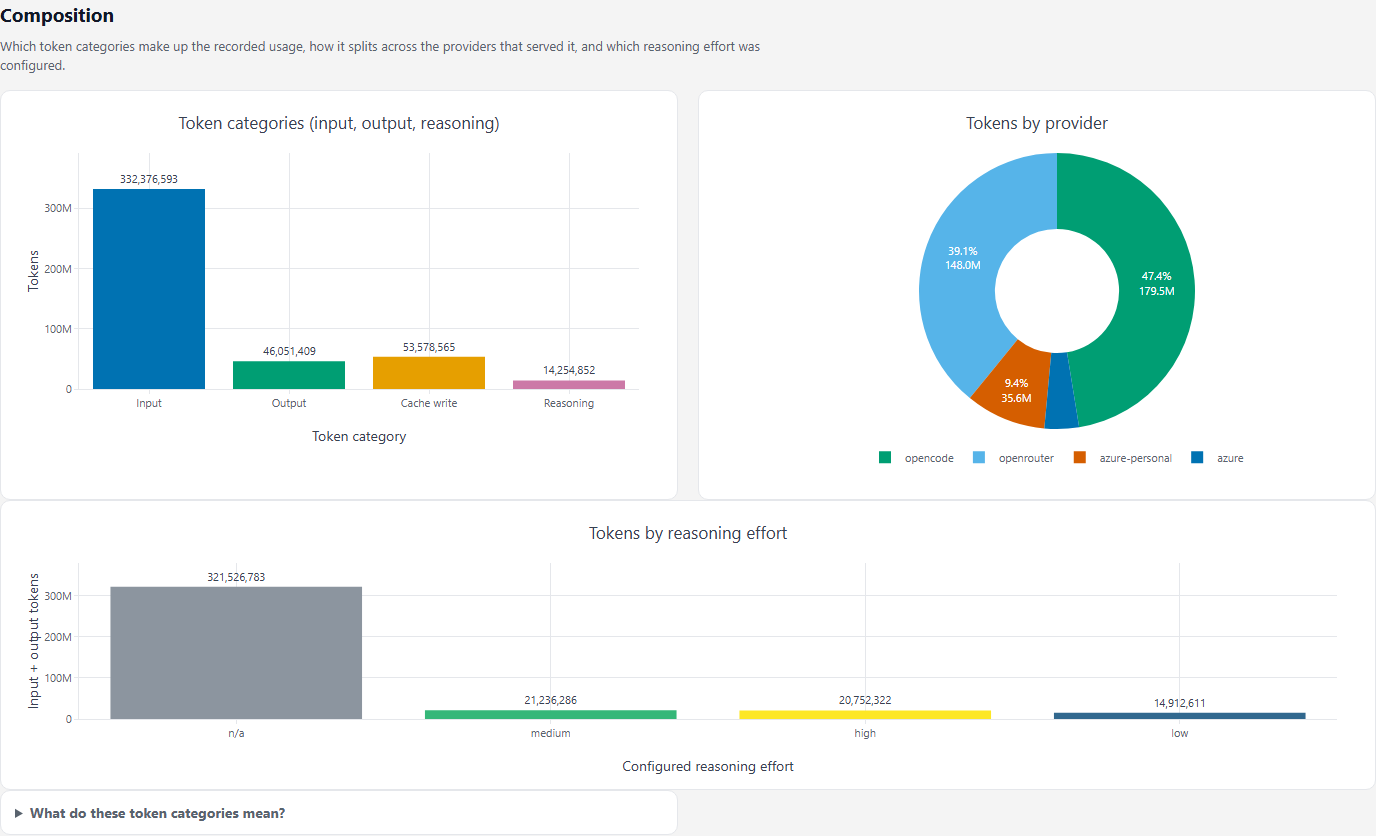 The whole page at mobile width: Regenerate them after changing the dashboard layout:
python tools/make_sample_data.py --out sample_usage.csv
python dashboard.py --in sample_usage.csv --out sample_dashboard.html
python tools/make_screenshots.py --html sample_dashboard.html --out-dir docs/images
Metrics
The export uses one row per session, day, provider, model, and variant. total_tokens is input plus output tokens, matching the definition used by the Copilot CLI Usage Dashboard. Reasoning and cache tokens remain separate counters and are not added to that headline total. Cost is the amount recorded by OpenCode, not a recalculated estimate or an invoice.
When multiple CSVs contain the same session/model/day, the dashboard keeps the row from the latest export timestamp and warns that it found overlapping records. This avoids adding repeated snapshots of the same local history.
Provider is OpenCode’s provider ID. Model is stored as provider/model so models with the same name from different providers remain distinct. Project names are reduced to the last directory segment to avoid exporting full local paths.
Privacy
The database is opened read-only and copied to a temporary SQLite snapshot before extraction so the live OpenCode process is not modified or locked for the duration of the read. The CSV and generated HTML can contain usernames, project names, model names, dates, and optional session titles. Review files before sharing them. Generated data files are excluded by .gitignore.
Limitations
- OpenCode’s local database schema is not a stable public API. Check Compatibility when OpenCode changes.
- Reported costs depend on the provider and pricing information available to OpenCode. The dashboard displays recorded cost and does not imply that it equals a provider invoice.
- Provider IDs identify the provider configured in OpenCode, which may be a gateway or service rather than the model vendor.
- The headline token total is deliberately input plus output. Compare cache and reasoning totals separately.
Development
python -m pip install -r requirements.txt -r requirements-dev.txt
python -m pytest
Most tests are plain unit tests. tests/test_dashboard_ux.py additionally drives the generated dashboard in a real browser, and skips itself when Playwright is unavailable:
python -m pip install playwright
playwright install chromium
python -m pytest tests/test_dashboard_ux.py -q
Sample data
A real export is usually too small to exercise the dashboard: a few days of history, and no recorded cost for free-tier models, leave the cost and reasoning-effort sections with nothing to show. tools/make_sample_data.py generates a deterministic synthetic export with the same schema, 90 days of history, and a deliberate mix of free and paid models.
It is seeded, so repeated runs produce byte-identical output. Project names use the fictitious companies Microsoft uses in documentation, so no real project name can reach a published screenshot.
python tools/make_sample_data.py --out sample_usage.csv
python dashboard.py --in sample_usage.csv --out sample_dashboard.html
Screenshots
python tools/make_screenshots.py --html sample_dashboard.html --out-dir docs/images
Captures each section at desktop and mobile widths. Regenerate after changing the dashboard layout. Requires the Playwright install above.
Attribution and related projects
This project began as an adaptation of github.com/microsoft/ghc-cli-dashboard, the Copilot CLI usage dashboard, which is also MIT licensed. The two-file shape of the tool — a SQLite extractor that writes a CSV, and a renderer that turns one or more exports into a self-contained HTML page — comes from there, as does the total_tokens definition (input plus output, with reasoning and cache counters kept separate) and the export/overlap handling.
Substantial parts of that original remain, including extract_usage.py, dashboard.py and the test suite. This fork changes the data source to OpenCode’s local store, and replaces the rendering layer, chart palette and section layout. Microsoft Corporation’s copyright is retained in LICENSE and in the headers of the derived files, as the MIT licence requires.
If you use GitHub Copilot CLI, use microsoft/ghc-cli-dashboard instead — it is the maintained upstream tool for that CLI.
Parity records what this dashboard does not yet do compared with the upstream one, including the filter, metric-toggle and redaction features that are still outstanding.
Trademarks
This project may reference trademarks of other projects, products and services. Any use of Microsoft trademarks is subject to Microsoft’s Trademark & Brand Guidelines, and use of Microsoft trademarks or logos here must not imply Microsoft sponsorship or endorsement. This is an independent community project.
Licence
MIT. See LICENSE.