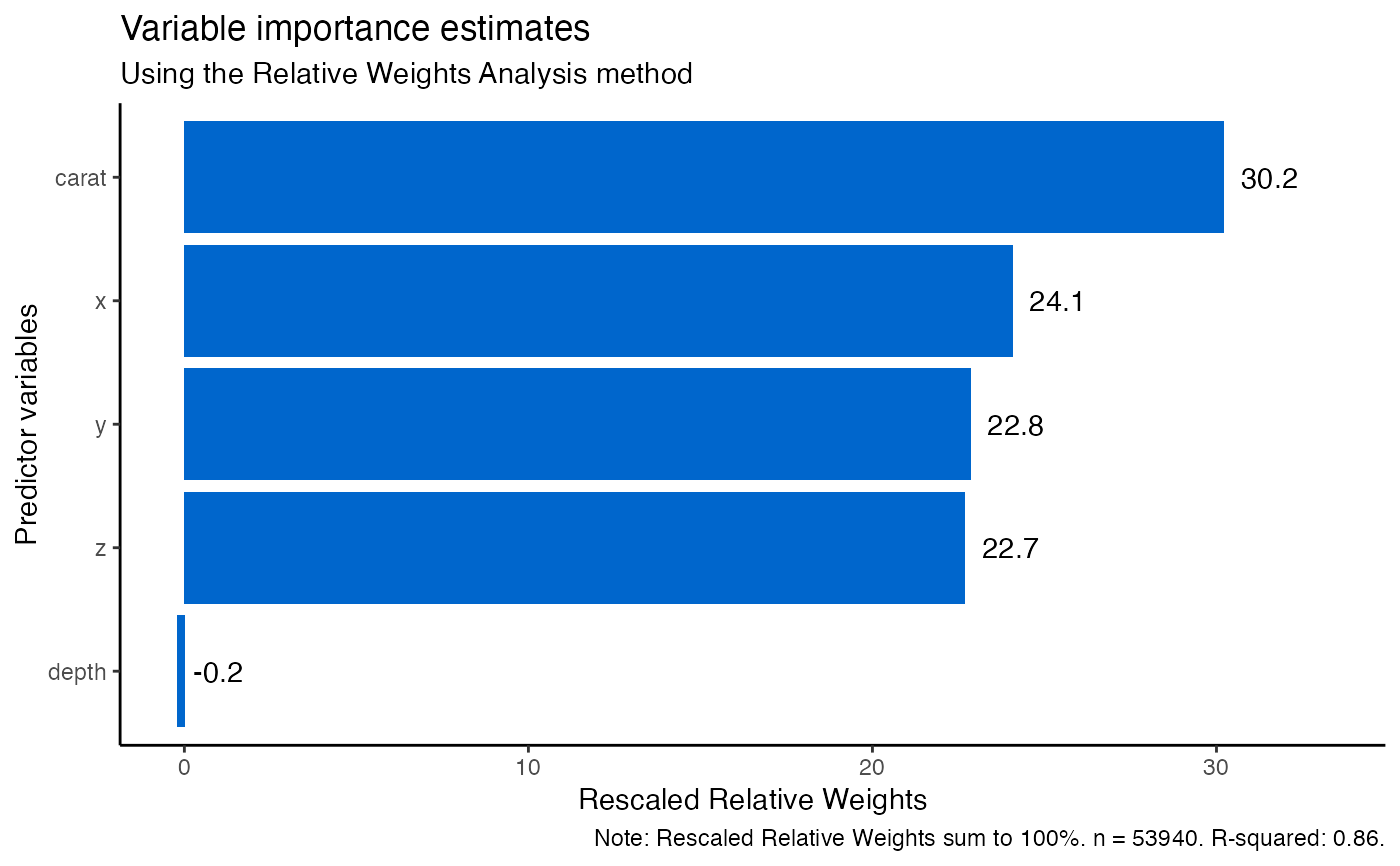
Pass the output of rwa() and plot a bar chart of the rescaled importance values.
Signs are always calculated and taken into account, which is equivalent to setting the applysigns
argument to TRUE in rwa().
Arguments
- rwa
Direct list output from
rwa().
Examples
library(ggplot2)
# Use a smaller sample for faster execution
diamonds_small <- diamonds[sample(nrow(diamonds), 1000), ]
diamonds_small %>%
  rwa(outcome = "price",
      predictors = c("depth","carat", "x", "y", "z"),
      applysigns = TRUE) %>%
  plot_rwa()
#> Parsing `price` as a non-binary variable.
#> Applying multiple regression to calculate relative weights...